 by Aaron Gruen, Debra Jeans, and Andrew Ratchford
Published In Midwest Flyer Magazine February/March 2022 Online Iissue
PURPOSE OF ECONOMIC IMPACT ANALYSIS
The common purpose of any economic impact analysis is to quantify the total impact of a change in economic activity, or one source of economic activity, on a broader economy. Economic impact analysis of airports and aviation activities can be used to measure and describe the linkages and importance of air travel connections to local and regional economies.
OVERVIEW:
THE ECONOMIC EFFECTS OF AIRPORTS
Regions with airports can attract and retain growing businesses that value accessibility to airports and high levels of air connections for passenger travel and cargo delivery. The transportation access provided by proximity to airports with air service capacity affects the structure, size, and growth of the economic base of regions. Regions with high-quality and sufficient capacity of airport infrastructure are more successful in attracting, retaining, and fostering growth of businesses that value airport accessibility, particularly the primary drivers of economic growth or transition from old-line manufacturing to high-order service industries.
Air passenger facilities are essential to many service-type facilities and industries, while certain goods-producing industries depend upon air-cargo facilities. Advertising, computer and data processing, accounting and auditing, management/public relations and legal services, for example, are concentrated in metropolitan areas which have excellent air connections. The greater concentration of service sector and finance, insurance and real estate sector industries in metropolitan areas with high-quality airports suggest that excellent air travel connections are a critical location factor for businesses which export their services (i.e. send out personnel or bring in customers by air travel, because they provide their services to customers outside of their region of domicile). Similarly, jobs related to the convention/tourism industry are clearly linked to wide-ranging, frequent, and low-priced air travel connections.
Paradoxically, the digital communications revolution that has diminished the importance of physical proximity in location decisions, has increased the importance of airports for social and economic development opportunities because of the expansion of the size of networks of firms and individuals. Consultants and many other types of businesses are not confined to serving local areas, but to maintain and grow business relationships over extensive geographic markets post Covid 19, will need to move beyond “Zoom” or “Teams” video-conferences and meet and dine in person with clients and customers.
The growth of aviation has served as an economic development catalyst.1 Just as the growth of the railroad industry facilitated connections and encouraged interdependencies between urban and rural markets, the aviation industry has been a key factor behind globalization and shifts to just-in-time manufacturing and inventory techniques. The ability to quickly vary or customize goods and services to the specifications of the customer base is one of the principal requirements for business success today. Flexibility and speed are key comparative advantages which superior air connections permit firms to exploit. Proximity of an airport is frequently an important factor in site location decisions.2 Communities with access to adequate airport capacity have stronger economic growth and rising incomes than communities without such access.
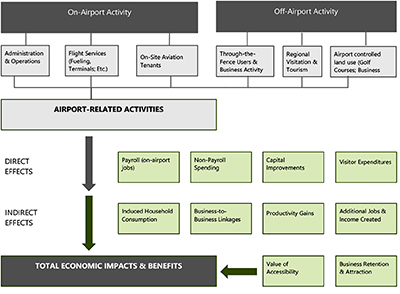
CONTRIBUTIONS OF AIRPORTS TO REGIONAL ECONOMIES
The following chart illustrates the contributions outlined above airports make to regional economies.
MEASURES OF ECONOMIC IMPACTS
The economic impacts generated by airports are typically measured and quantified in terms of employment (the number of full- or part-time jobs created), labor income (the sum of wages, salaries, benefits, and proprietor income); and output (the economic value of all goods and services produced in the region). For capital projects that may have only a limited duration or “one-time” impact on an economy (such as reconstructing a taxiway or developing a terminal building), the measure of employment impact is commonly expressed as the number of “job-years” created from that capital expenditure.
TYPES OF ECONOMIC IMPACTS
The total economic impact of an airport represents the sum of three different economic effects. These include Direct Effects, Indirect Effects, and Induced Effects.
Direct Effects are typically defined as the initial round of expenditures related to all airport operations including labor purchases (i.e., payrolls) and non-payroll expenditures. These direct expenditures or “inputs” encompass both the airport operations itself, as well as the economic activities associated with on-airport tenants (hangar occupants, air carriers, on-airport hotels or rental car facilities, retailers and restaurants inside a passenger terminal, etc.).
The spending associated with non-local air passengers and other airport-dependent tourism activities are also considered a direct effect, even if such activities occur “off-site.” Without one of the world’s busiest airports, O’Hare International Airport in Chicago, Illinois for example, the amount of convention-related business would be far less in Chicago.
Many non-aviation businesses make their site/facility location decisions based on proximity to an airport. While more difficult to quantify, off-airport jobs and activities that depend highly upon proximate accessibility to an airport (activities which otherwise would not exist in the region) would also be appropriate to consider as direct effects.
Indirect Effects can be described as the changes in economic activity that result from supply chain inputs required by the airport and directly related activities. Businesses buy products from each other creating indirect impacts on other industries. Therefore, a change in one industry will “ripple” through other industries. Consider the example of a small MRO firm occupying a hangar at a General Aviation airport. Assume final demand for MRO service has increased with traffic at the airport; now a greater volume of fabricated metal fasteners, aviation upholstery supplies – and so forth – are required. However, the impacts will not stop here; the upholstery supplier will purchase more textiles, the textiles manufacturer will buy more equipment, and so on. These sector-to-sector linkages are referred to as the Indirect Effects. The magnitude of these indirect or “ripple” effects largely depend upon the size of the local and regional economy and whether inputs can be supplied locally (or must be imported).
Induced Effects refer to the economic activities that result from the spending by workers whose wages or earnings are affected by airport activity – either directly or indirectly. These Induced Effects may be thought of as the “second round” of effects resulting from the first-round Direct and Indirect Effects. While an MRO business located on-site at an airport may not itself purchase food or medical services, its direct employees and indirectly supported workers (at suppliers) consume these goods and services.
The employment, income, and output multipliers are key variables in any economic impact analysis. They quantify the relationships between the direct, indirect and induced effects described above. The magnitude of the multipliers depend upon the extent to which businesses purchase their inputs from other businesses located in the same region or geographic area such as a county, as contrasted with the purchase of inputs from businesses located outside the region or relevant geographic area such as a county. Multipliers vary among industries and among geographic areas. For example, larger and more diverse regions will tend on average to have larger industry multiplier effects because of a greater likelihood of tighter linkages within the region. That is, an industry’s inputs will be more likely to be provided by other businesses within the region.
The multiplier is the coefficient that relates the magnitude of a Direct Effect to the total economic impact (which includes the Indirect and Induced Effects).
HOW TO INTERPRET MULTIPLIERS
Consider an employment multiplier of 1.5; the interpretation is as follows, for every direct job, an additional 0.5 jobs are generated through a combination of the indirect and induced impacts. For income multipliers, it is the change in personal income (the sum of wages and salaries and proprietor income) within the region for every dollar change in demand induced by the airport and associated activities. An output multiplier is defined in the change in the regional output for every dollar of final demand induced by the airport and its associated activities. For example, if the value of the output multiplier is 1.8, this means that for every dollar increase in production as the result of the presence of the airport and its associated activities, total production in the region increases by $1.80. Of that $1.80, $1.00 is the direct result of the increase in final demand as the result of the airport and related activities direct expenditures, and $0.80 is the indirect increase in production within the region as the result of related industries increasing their output of goods and services to meet the demand requirements of the airport and its associated activities.
A COMMON METHOD OF ESTIMATING ECONOMIC IMPACTS
A common method of estimating the economic impacts of airports is through the use of input-output models. Input-output models are based on an extensive table or snapshot of the region’s market transactions between industry sectors, between industry and household sectors and between regional sectors and sectors outside the region. An initial demand stimulus, such as airport activity, yields a set of multipliers from the transactions table based on distribution of the impacts of the airport activity distributed by the affected industry and household sectors to produce final employment, income, and output impacts.
Studies in the United States utilizing input-output models tend to employ one of two models. One type is the RIMS II input-output model produced by the United States Bureau of Economic Analysis. This model has been “regionalized” for each of the states and for major metropolitan areas. Earnings-by-industry and personal consumption expenditure data are used to include households as both suppliers of labor and purchasers of final goods and services.
IMPLAN3 organizes the local economy into 432 separate industries based on the North American Industry Classification System (“NAICS”) and is an accounting system of transactions that occur through forward and backward linkage in the economy. IMPLAN contains three primary components: the flow-table, direct coefficients, and direct, indirect, and induced coefficients. The input-output accounting traces the flow of dollars between businesses and between businesses and final consumers. The multipliers produced by the model are customized for the economic activity in any set of contiguous U.S. counties. These multipliers represent ratios of total to partial changes in economic activity. When these ratios are multiplied by a change in final demand that is specific to a local economic stimulus such as the expansion of an airport, the result is an estimate of a total change in the local economy. RIMS II provides both Type I and Type II multipliers. Type I multipliers account for the direct and indirect impacts based on how goods and services are supplied within a region. Type II multipliers not only account for these direct and indirect impacts, but they also account for induced impacts based on the purchases made by employees. RIMS II is a “backward-linkage” model such that if an economic sector or industry increases production, increased demand occurs in those sectors or industries that produce the intermediate inputs.
CASE STUDY EXAMPLES OF ECONOMIC IMPACTS OF AIRPORTS
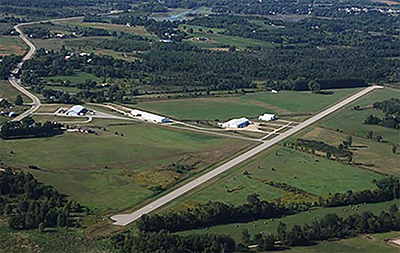
 The DuPage Airport, located about 30 miles west of Chicago, serves the largest concentration of corporate aircraft in Illinois. The airport property consists of approximately 2,800 acres of land and features the DuPage Flight Center, four active runways, two ILS approaches, a 24-hour FAA Air Traffic Control Tower, and an onsite U.S. Customs office. The airport property also includes the revenue-generating Prairie Landing Golf Club designed by Robert Trent Jones, Jr. that also serves as a buffer and drainage area. The Prairie Landing Golf Club includes a pro-shop, restaurant, and banquet facility. Another part of the airport, the DuPage Business Center, contains a total of 331 acres of developable land. Approximately 64 percent or 213 acres of the business park has been developed and absorbed with 2,938,000 square feet of industrial building space relatively recently completed or currently under construction. Approximately 118 acres of land have been sold (or optioned) for industrial uses.
The following section summarizes the estimated economic impacts associated with the DuPage Airport.
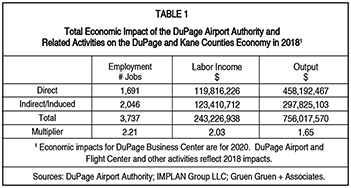 Table 1 summarizes the total annual economic impact of the DuPage Airport Authority, including the DuPage Airport, Flight Center, and on-site businesses, Prairie Landing Golf Course, and DuPage Business Center on the DuPage and Kane Counties economy.
The total direct and indirect employment impact of the airport and related activities on the DuPage and Kane Counties economy is estimated at 3,737 jobs. The total direct and indirect annual labor income impact is estimated at $243.2 million, or approximately $65,000 per job. The total output impact – that is, the total volume of economic activity supported – is estimated at $756 million annually within DuPage and Kane Counties.
Expenditures made by the DuPage Airport Authority, Prairie Landing Golf Course, on-site businesses, the existing tenants of the DuPage Business Center, and airport visitors, directly support 1,691 jobs within DuPage and Kane Counties. These expenditures directly generate $119.8 million of additional income within the two counties, or approximately $71,000 of income per job. Total direct annual output associated with the airport and related activities is estimated at $458.2 million.
Indirectly, airport-related spending supports an additional 2,046 jobs within DuPage and Kane Counties and $123.4 million of labor income (approximately $60,000 of labor income per indirect job supported). The employment and income multipliers are 2.21 and 2.03 respectively, indicating that for every 10 directly-supported jobs, an additional 12 jobs are supported indirectly within the two counties; and for every $10.00 in direct income, an additional $10.30 is created indirectly.
Chicago Executive Airport
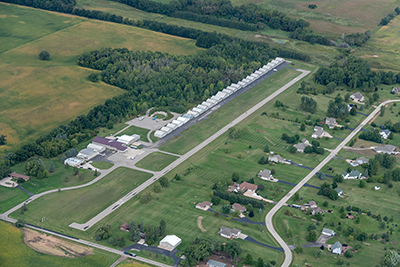
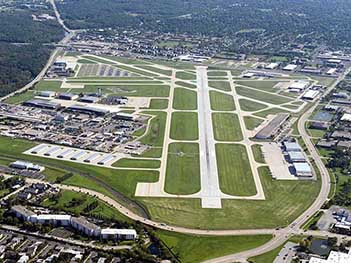
Chicago Executive Airport, formerly Palwaukee Airport, is located about 18 miles northwest of Chicago in the Village of Wheeling in Cook County, Illinois. The airport is jointly owned by the City of Prospect Heights and the Village of Wheeling. The airport has more than 181 based aircraft and is the busiest reliever in the Chicago metropolitan area. The airport has three runways and a U.S. Customs office, and hosts three fixed base operations and multiple aircraft charter operations and aircraft maintenance facilities.
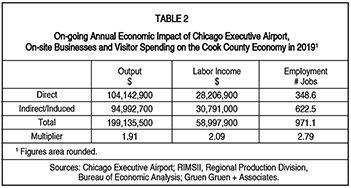 Table 2 summarizes the total annual economic impact of Chicago Executive Airport including the airport and on-site businesses on the Cook County economy in 2019.
The total direct and indirect employment impact of the airport and related activities on the Cook County economy is estimated at 971 jobs. The total direct and indirect annual labor income impact is estimated at $59 million, or approximately $60,800 per job. The total output impact – that is, the total volume of economic activity supported – is estimated at $199.1 million annually within Cook County.
Expenditures made by the airport, on-site businesses, and airport visitors directly support 349 jobs within Cook County. These expenditures directly generate $28.2 million of additional income within Cook County, or approximately $80,900 of income per job. Total direct annual output associated with the airport and related activities is estimated at $104.1 million.
Indirectly, airport-related spending supports an additional 623 jobs within Cook County and $30.8 million of labor income (approximately $49,500 of labor income per indirect job supported). The employment and income multipliers are 2.79 and 2.09 respectively, indicating that for every 10 directly-supported jobs, an additional 18 jobs are supported indirectly within the county; and for every $10.00 in direct income, an additional $10.90 is created indirectly.
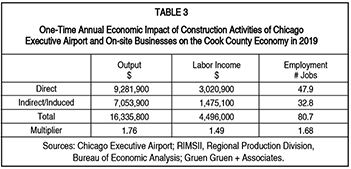 Table 3 summarizes the total one-time economic impact of construction activities of Chicago Executive Airport, including the airport and on-site businesses on the Cook County economy in 2019.
For the one-time construction impacts of the construction activities of the airport and on-site tenants, the total (direct and indirect) annual employment impact on the Cook County economy, is estimated at nearly 81 jobs. This is full- and part-time jobs, not “full-time equivalent” estimates. The total (direct and indirect) income impact on the county is estimated at approximately $4.5 million, or approximately $55,700 per job. The total output impact – or the total volume of economic activity supported – is estimated at $16.3 million.
Studies like those sponsored by DuPage International Airport and Chicago Executive Airport can be used to inform the public and civic leaders of the economic and fiscal contributions generated by local airports so that support for airport activities, expansions, and enhancements can be garnered.
The authors are members of Gruen Gruen + Associates (www.ggassoc.com), a research-based real estate and economics consulting firm that have extensive experience studying the economic and fiscal impacts of airports and planning and assisting in the implementation of development of aviation and non-aviation uses on lands controlled by airports.
1 Air travel, for example, transformed Phoenix. “Airline travel is a force of concentration on urban form . . . . So air travel had the effect of concentrating business activity in fewer, larger cities with substantial airports. Those cities became dominant centers of regional areas, with the big airport being the hub of other transportation modes.” Grady Gammage Jr., Phoenix in Perspective, 1999, pg. 33.
2 Boeing and Caterpillar relocated to the Chicago metro region (Boeing to Downtown Chicago and Caterpillar to Deerfield) in part because of superior aviation infrastructure. See, for example, https://hbr.org/2001/10/inside-boeings-big-move; https://www.chicagotribune.com/business/ct-caterpillar-headquarters-deerfield-0420-biz-20170419-story.html.
3 IMPLAN was initially developed in 1976 by the U.S. Forest Service to evaluate the socioeconomic impacts on local communities of alternative forest land management strategies. In 1985, the responsibility for developing “IMPLAN” data sets and models was transferred to the University of Minnesota which formed an independent entity to serve organizations other than the U.S. Forest Service. A national dataset and regional models have been developed, maintained and enhanced over time.